Per- and polyfluoroalkyl substances (PFAS) are a suite of chemicals that have been emerging contaminants of concern in recent years. PFAS chemicals have historically been used in non-stick and protective coatings, waterproofing fabrics, fire-fighting foams, and other industrial settings. These chemicals are persistent in the environment (they don’t break down and can accumulate over time) and in 2016 the USEPA issued guidance for two of the most common PFAS chemicals (PFOA and PFOS).
As PFAS are relatively new contaminants on the scene in the environmental remediation industry, Azimuth1 was interested in learning how the behavior of PFAS at groundwater impacted sites differs from traditional contaminants of concern. To answer this question, we examined data from more than 500 groundwater sites across the country which have PFAS contamination. We looked at data from 48 states and at contaminated sites ranging from airports to fire stations to a NASA facility. To understand how PFAS contaminant plumes compare to other contaminant site data from across the country, we referenced our EnviMetric database, which contains information from more than 86,000 contaminated sites. We developed this database with support from the National Science Foundation and use it to make predictions about contaminant behavior at sites currently involved in investigation efforts.
Don’t have much time? Check out the key findings here:
How PFAS groundwater plumes compare to other common contaminants of concern:
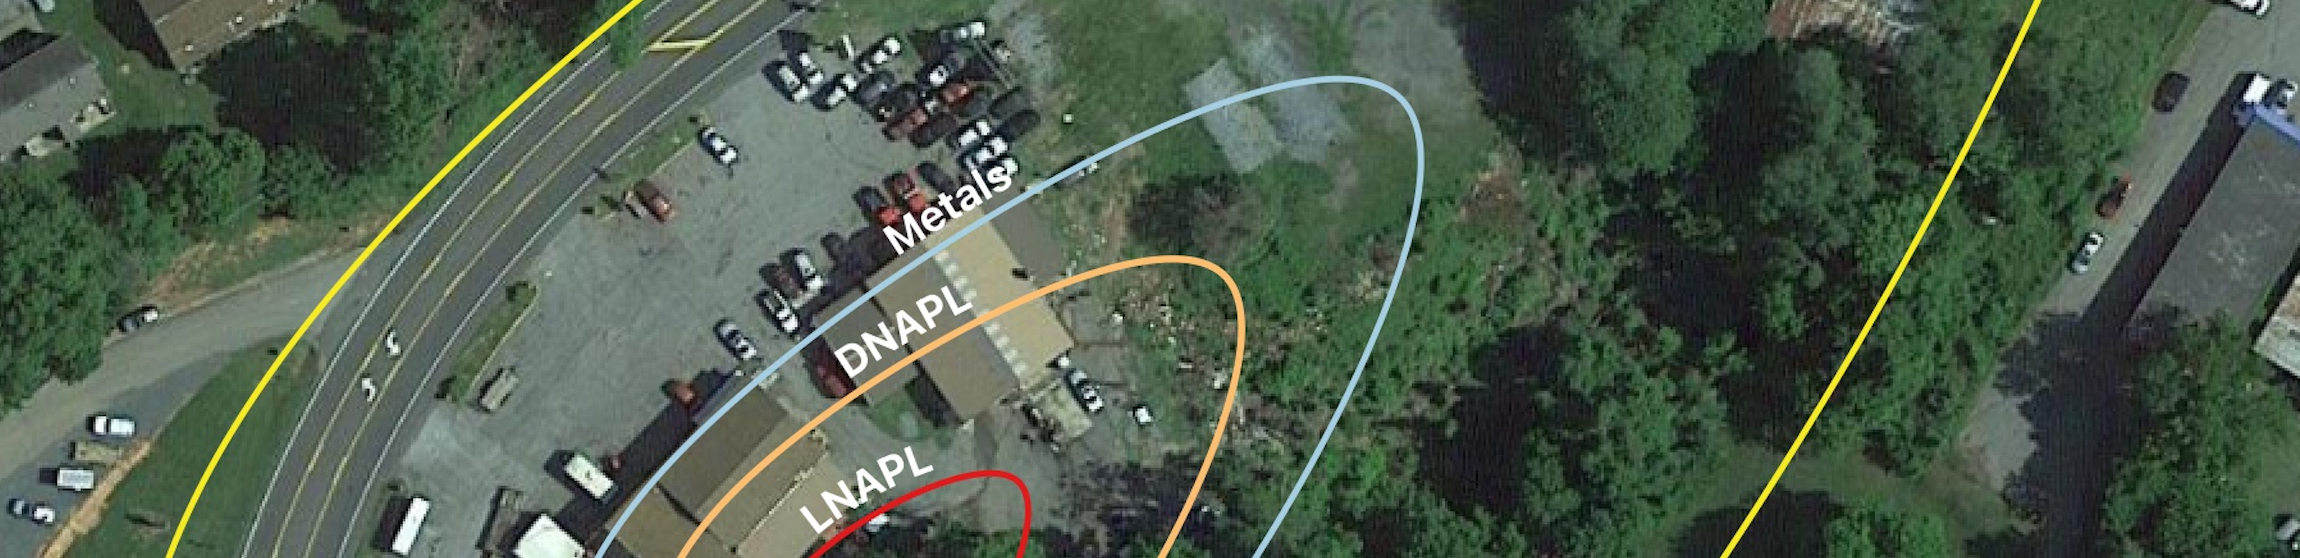
- PFAS plume lengths tend to be more than 3.5 times that of DNAPL plume lengths
- PFAS plume lengths tend to be more than 8.5 times that of LNAPL plume lengths
- PFAS plume widths tend to be more than 3 times that of DNAPL plume widths
- PFAS plume widths tend to be more than 6.5 times that of LNAPL plume widths
- DNAPL plume depths tend to be more than 1.5 times that of PFAS plume depths
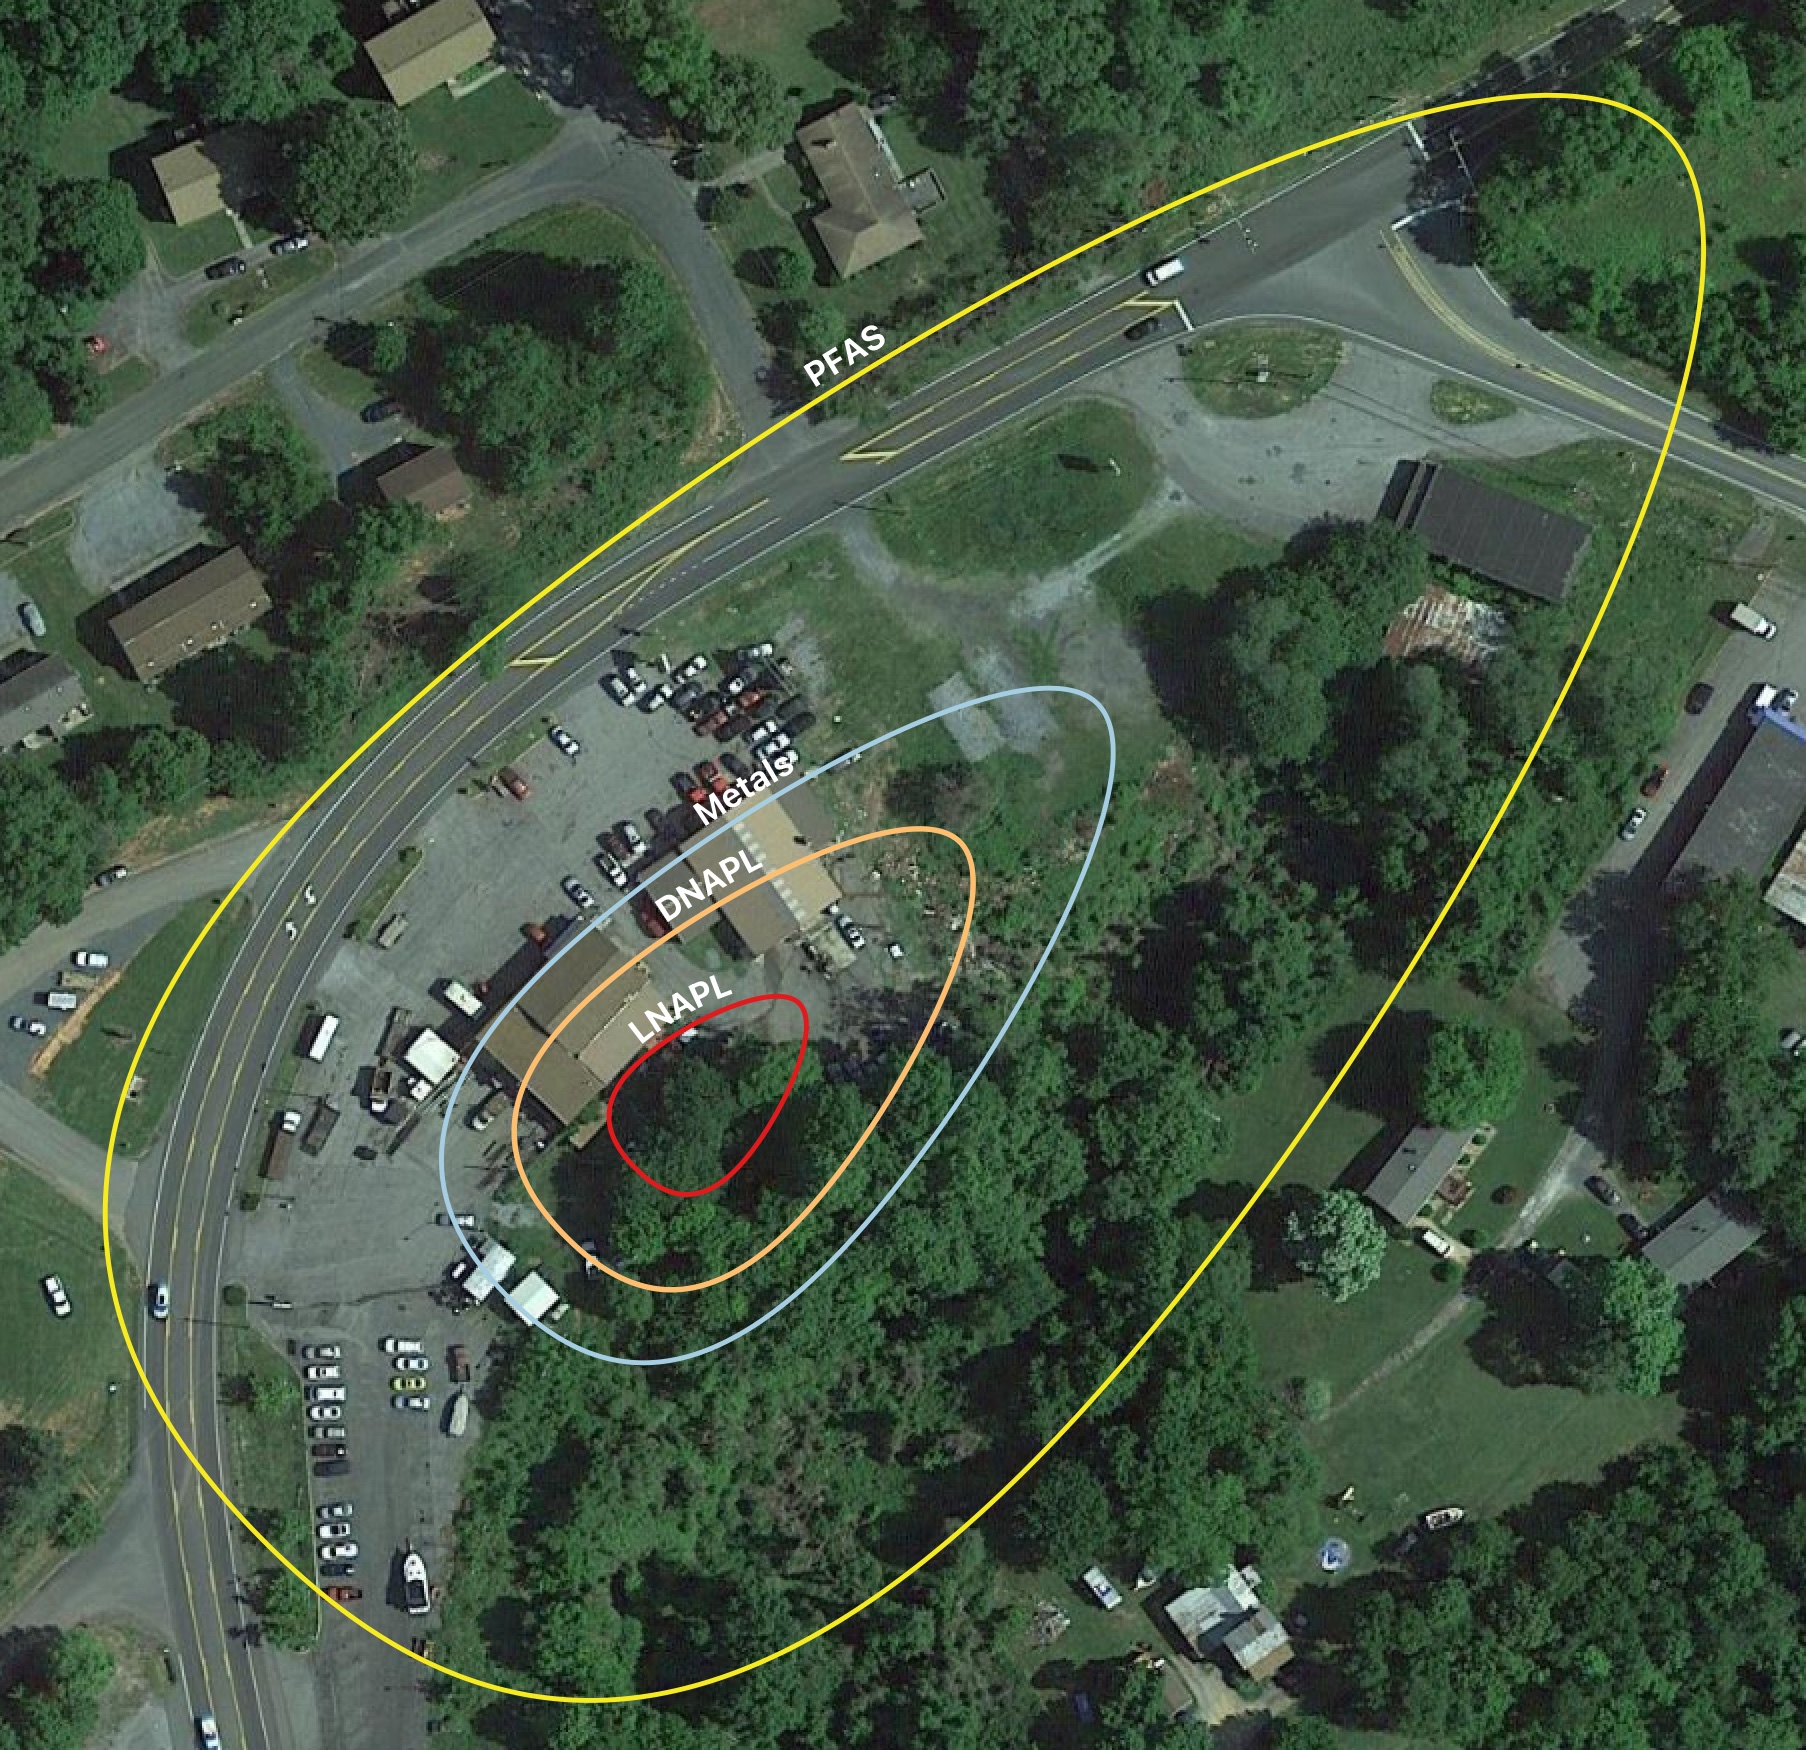
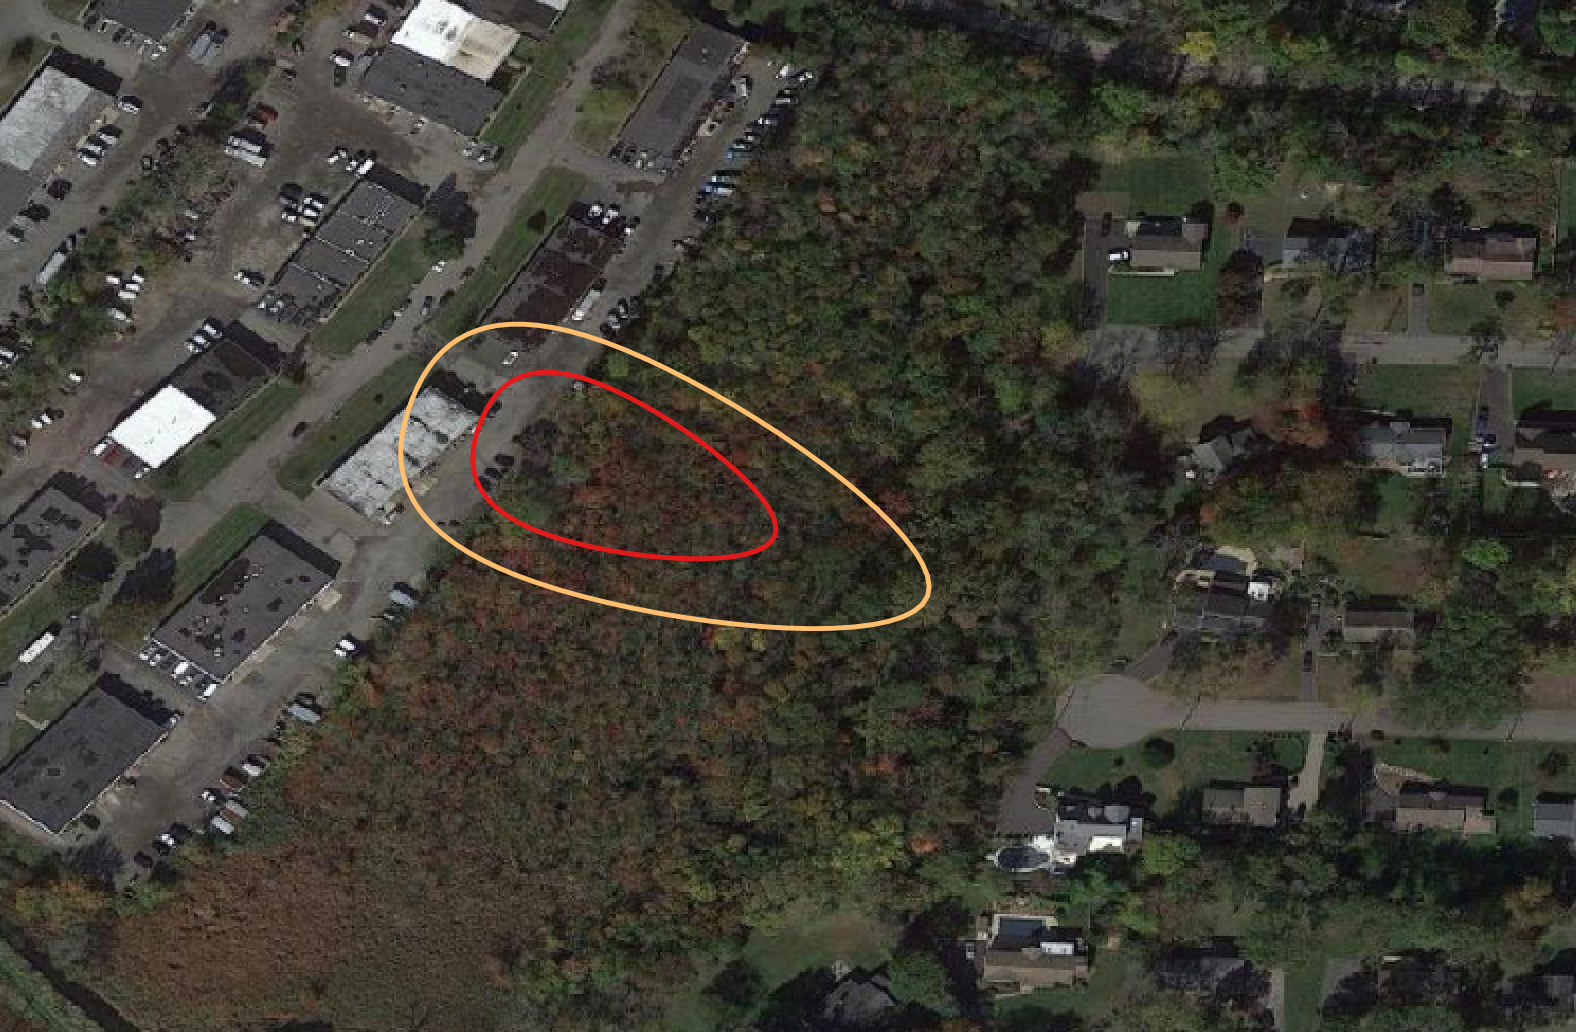
This figure shows the relationship between mode plume dimensions of different contaminant types (scale 1:2072).
PFAS by physiographic region:
The three physiographic regions of note for the largest plume dimensions are Basin and Range, East Gulf Coastal Plain, and the Great Plains.
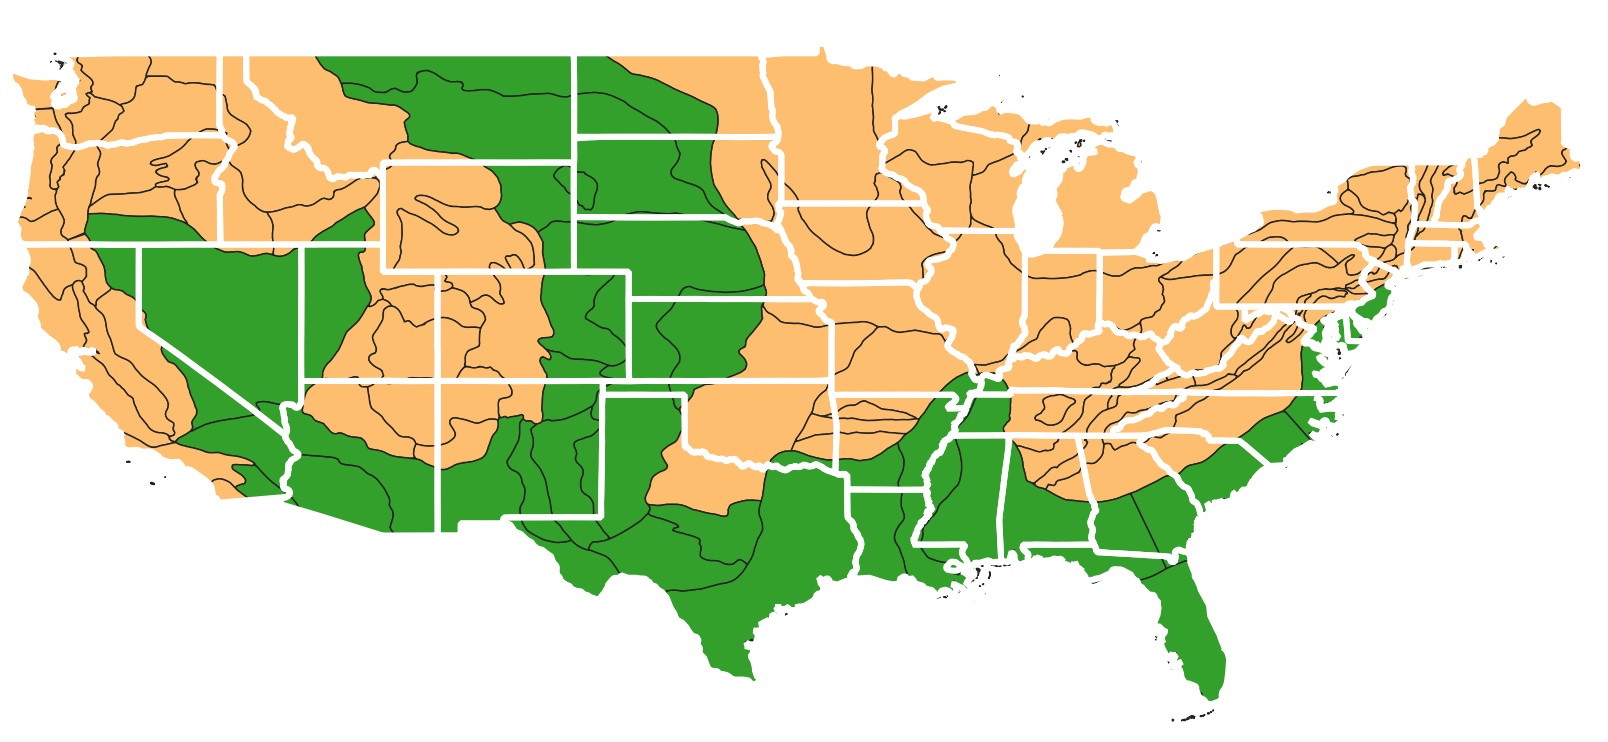
Green regions indicate the largest PFAS plume dimensions occur in these physiographic regions.
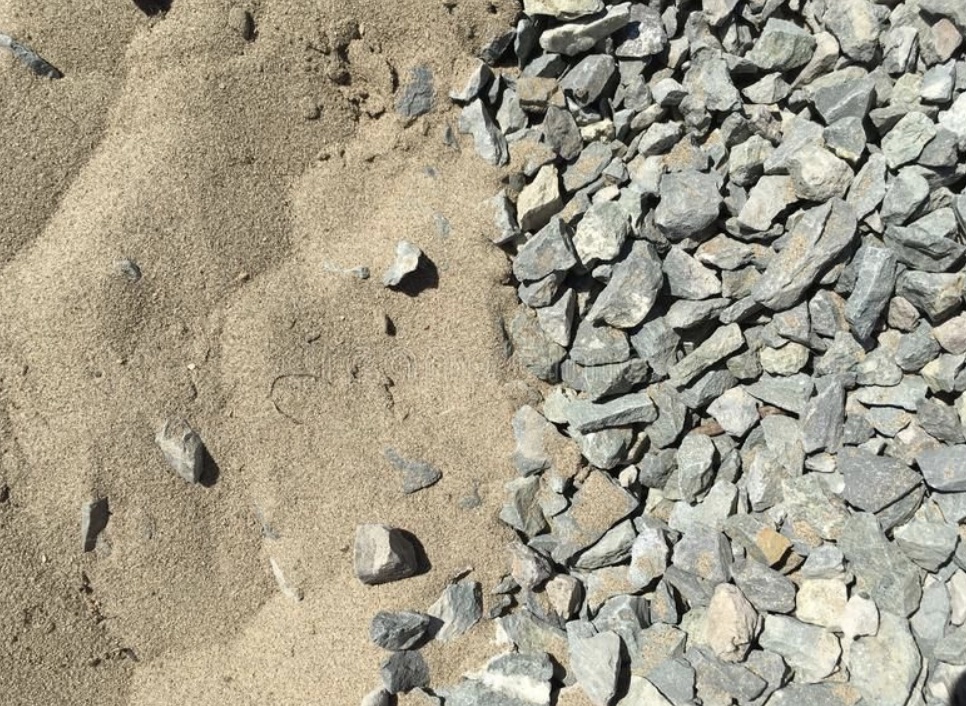
PFAS by soil type:
The largest PFAS plume dimensions are found at sites with sand or gravel in the subsurface. No surprise there!
PFAS plumes by site type:
- PFAS plumes at fire fighting training sites were by far the largest.
- PFAS plumes at fire fighting training sites were about 3 times longer than PFAS plumes at fire fighting foam application sites.
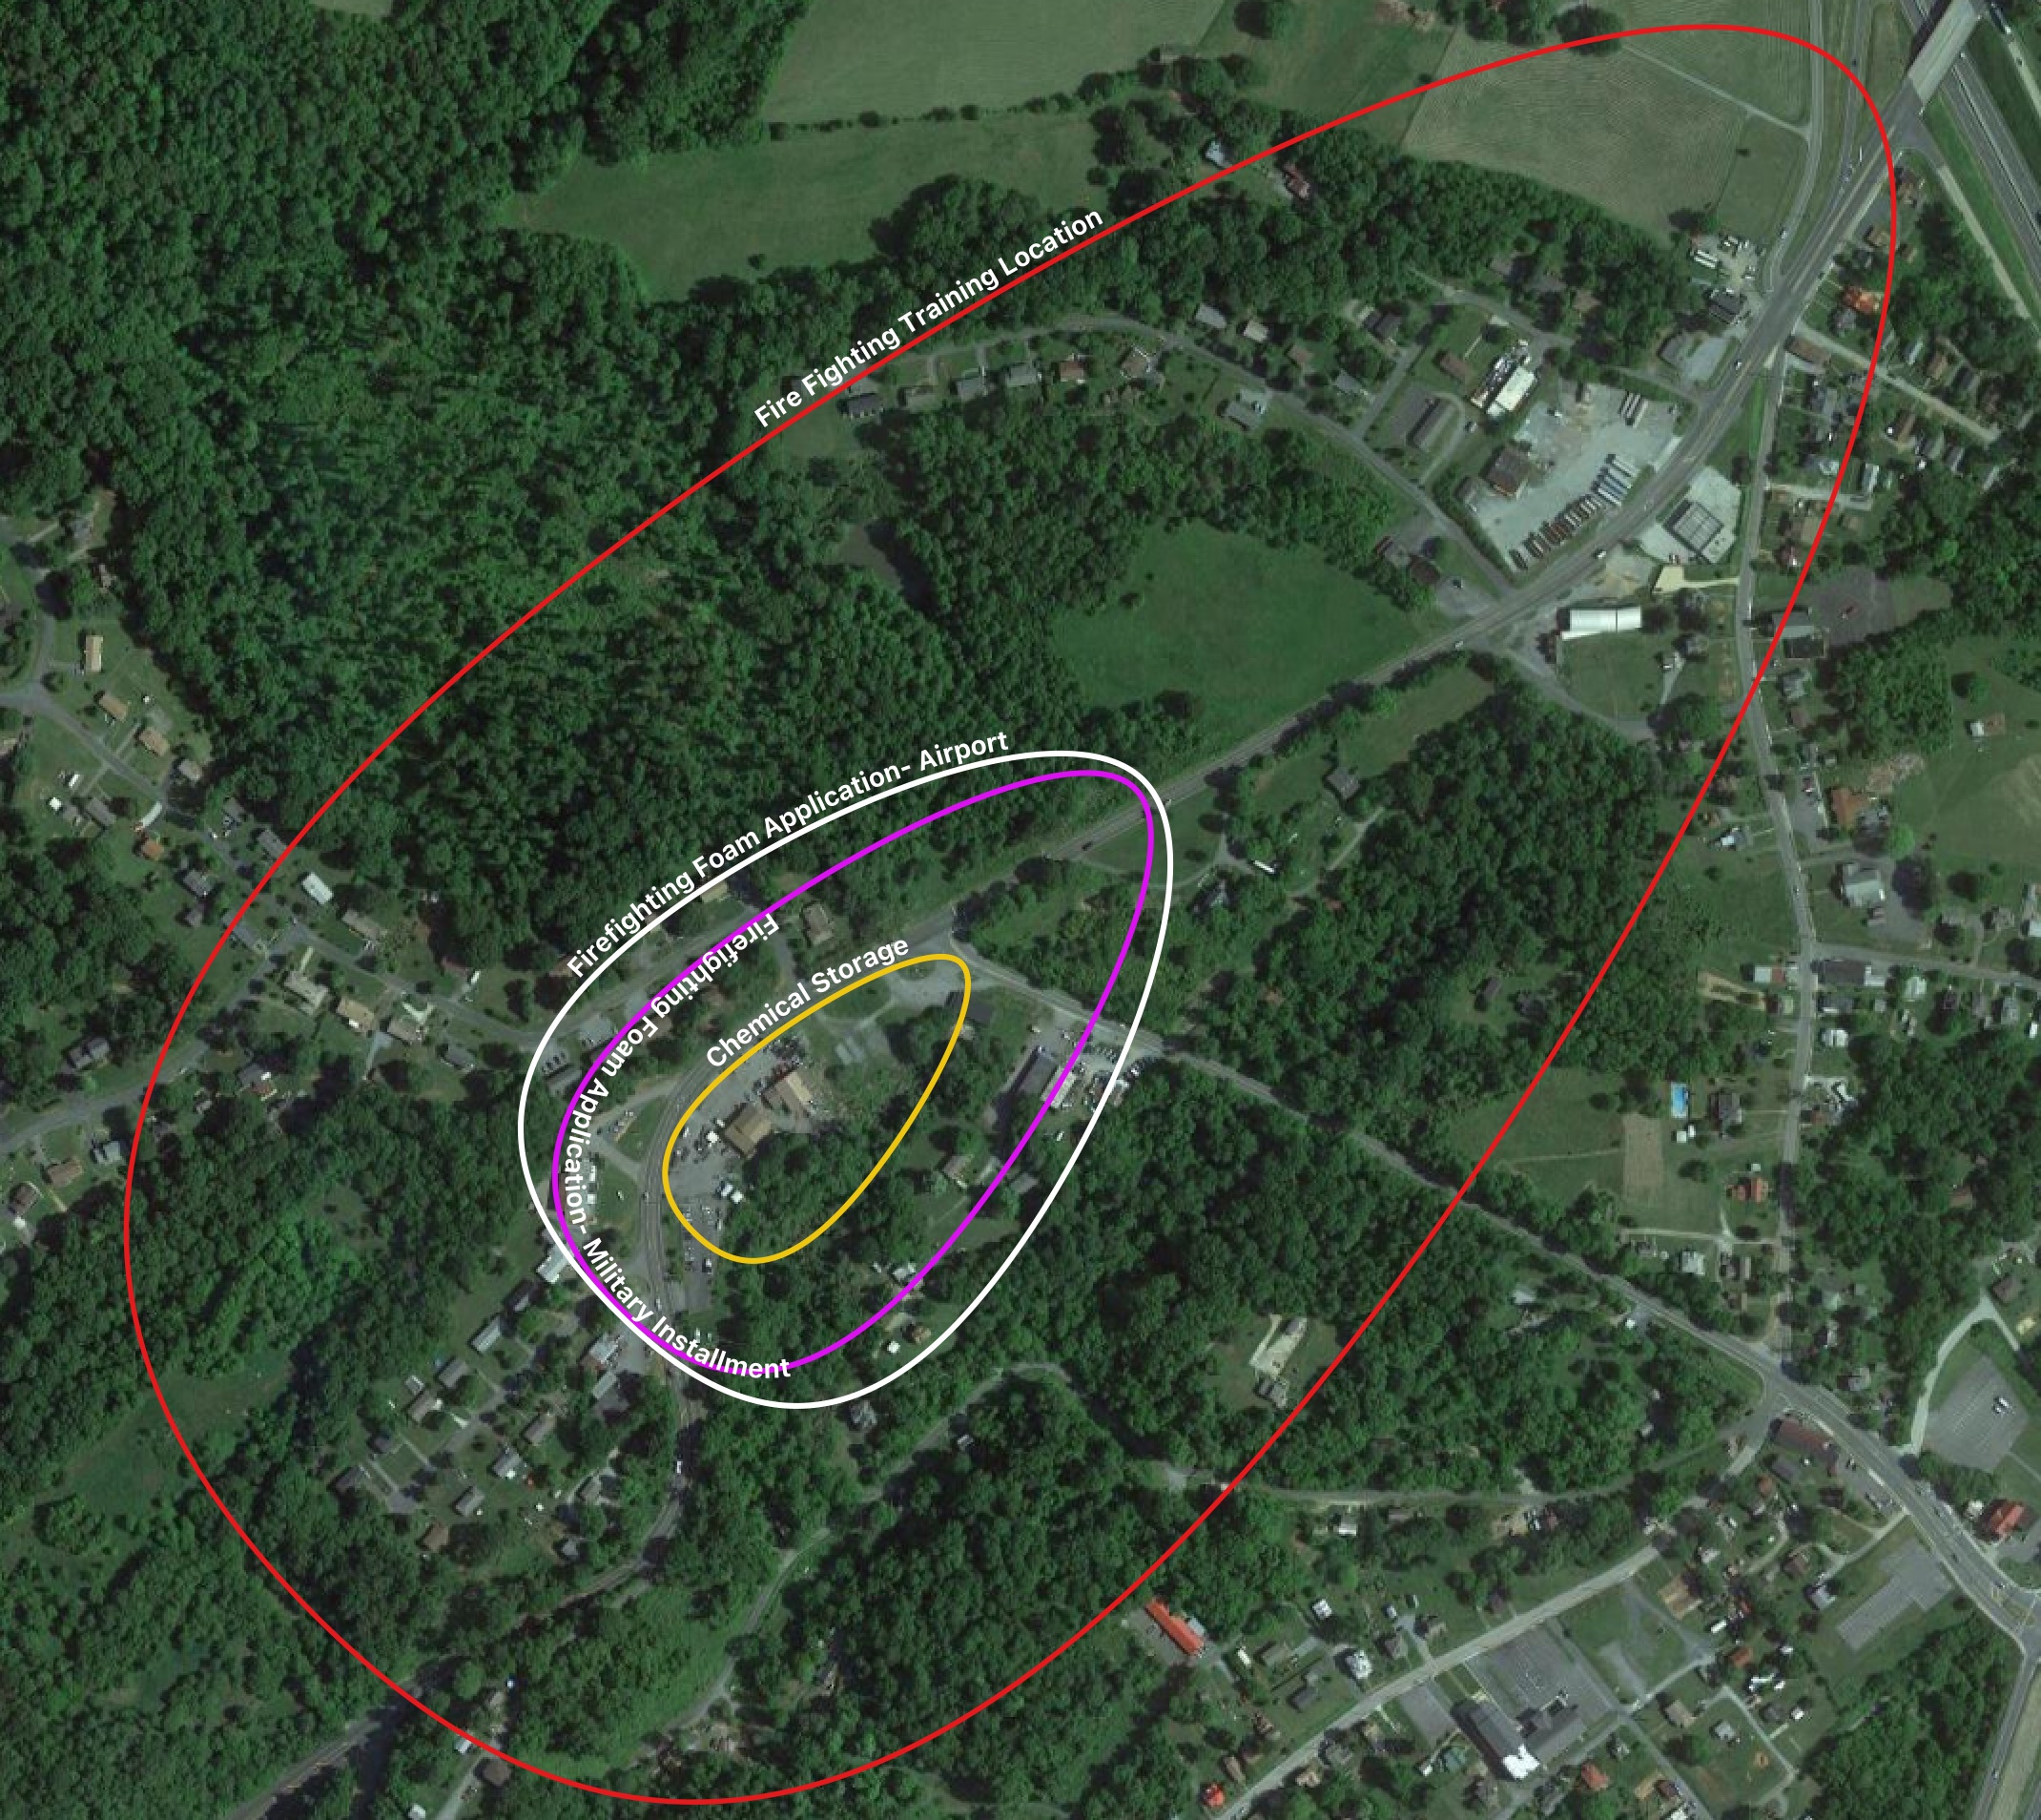
This figure compares the mean plume dimensions of common PFAS site types (scale 1:8057)
Read on to see the data behind these conclusions!
Data Analysis
Our data set: We examined data from hundreds of PFAS contaminated sites and looked at the following site characteristics: site location, source zone location, contaminant dispersion at site (in three dimensions), site geology, site hydrology, contaminant concentrations, release type, hydrogeology parameters (hydraulic conductivity, transmissivity, etc.), and geochemistry parameters (pH, ORP, etc.). Our data set covers 48 states (excluding Hawaii and Kentucky).
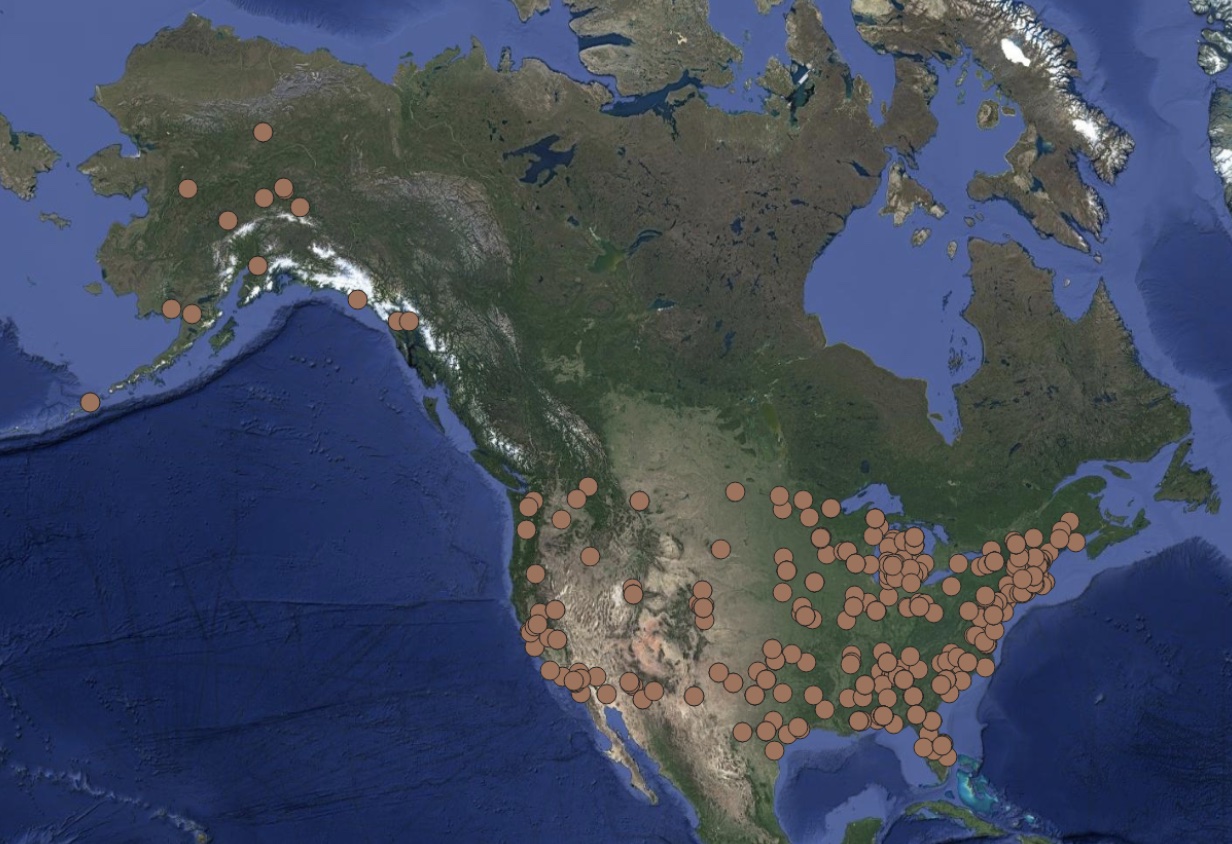
Figure: PFAS Data set coverage
Using all PFAS plumes in the database, a distribution of plume lengths, widths, and depths were generated. Table 1 shows the distribution percentiles of PFAS plume length, depth and width.
| Plume Dimension (ft) | 10th Percentile | 25th Percentile | 50th Percentile | 75th Percentile | 90th Percentile | 95th Percentile | 99th Percentile |
|---|---|---|---|---|---|---|---|
| Plume Length (ft) | 518.9 | 802.9 | 1126.6 | 1628.2 | 2435.9 | 3183.1 | 6992.6 |
| Plume Depth (ft) | 14.1 | 15.3 | 20.3 | 35.0 | 60.9 | 79.8 | 139.5 |
| Plume Width (ft) | 279.5 | 410.3 | 568.5 | 845.8 | 1261.2 | 1750.1 | 4178.8 |
Table 1
PFAS site data broken down by the physiographic region of the sites:
Next, sites were broken down by physiographic region.
| Physiographic Region | # Sites in Region | Mean Plume Length (ft) | Mean Plume Width (ft) |
|---|---|---|---|
| Appalachain Plateau | 7 | 976.0 | 638.1 |
| Basin and Range | 9 | 1984.0 | 946.7 |
| Central Lowland | 49 | 1384.8 | 748.9 |
| Coastal Plain | 83 | 1291.0 | 634.8 |
| Great Plains | 13 | 1981.4 | 1050.5 |
| Interior Low Plateau | 6 | 1315.3 | 654.0 |
| New England | 4 | 994.6 | 563.3 |
| Pacific Border | 3 | 1146.2 | 618.6 |
| Piedmont | 17 | 1145.5 | 626.9 |
| Valley and Ridge | 2 | 1035.2 | 665.7 |
Table 2
Violin plots are shown in the two below figures (violin plots are similar to box plots but with the addition of a kernel density plot on each side). The three physiographic regions of note for the range of plume dimensions in these figures are Basin and Range, East Gulf Coastal Plain, and the Great Plains.
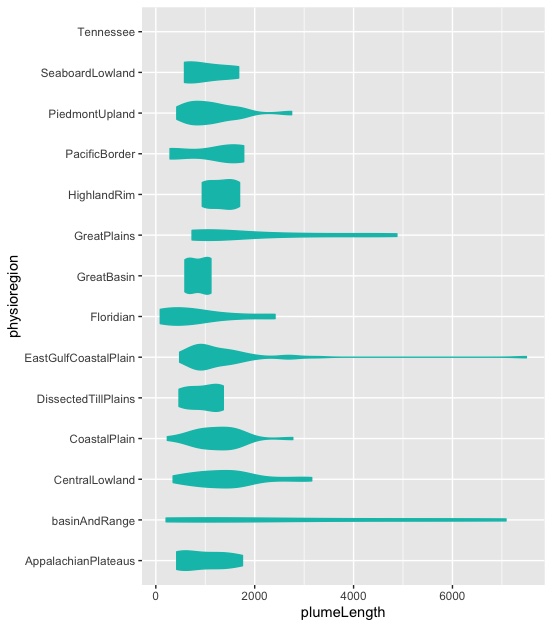
Figure: Plume Length vs Physiographic Region
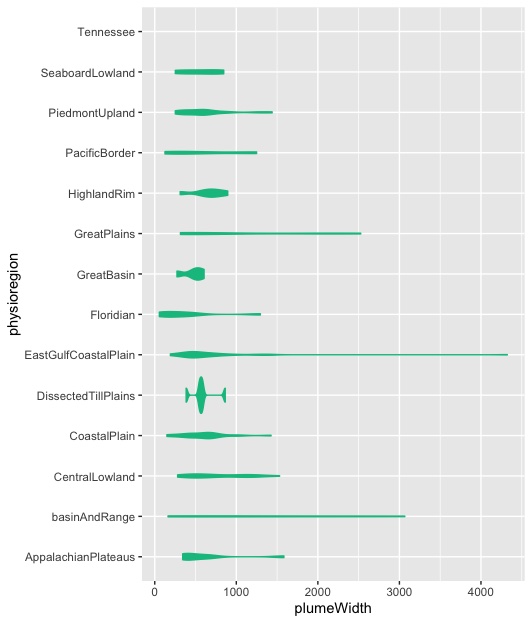
Figure: Plume Width vs Physiographic Region
PFAS by Hydraulic Conductivity/Soil Type:
Then sites were broken down by the most hydraulically conductive layer present at the site.
| Soil Type | Hydraulic Conductivity K (cm/sec) | # Sites in Category | Mean Plume Length (ft) | Mean Plume Width (ft) |
|---|---|---|---|---|
| Gravels | 10 to 0.5 | 35 | 1521.1 | 999.1 |
| Sands | 0.05 to 0.005 | 153 | 1361.3 | 711.2 |
| Silts | 0.0005 to 0.0001 | 26 | 1831.5 | 867.8 |
| Clays | 0.0000005 | 3 | 1030.4 | 582.1 |
Table 3
Violin plots are shown below of plume length and plume depth by most hydraulically conductive soil type present at the contaminated site for PFAS sites. Mean and standard deviation shown in red.
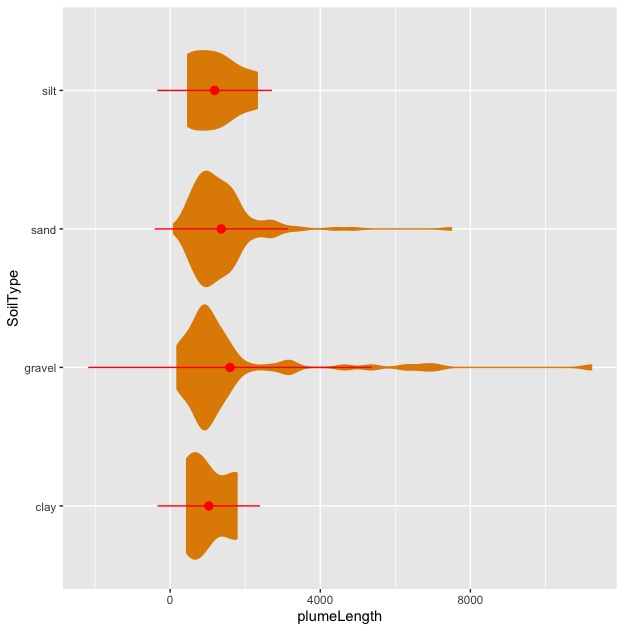
Figure: Plume Length vs Soil Type
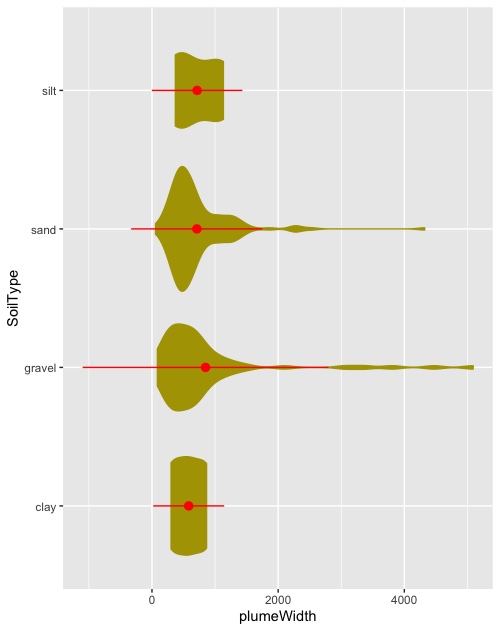
Figure: Plume Width vs Soil Type
PFAS vs. Other Contaminant Types:
For all of the following plots, the red curve represents data from LNAPL sites, the green curve represents data from DNAPL sites, the blue curve represents data from heavy metals sites, and the black line represents data from PFAS sites.
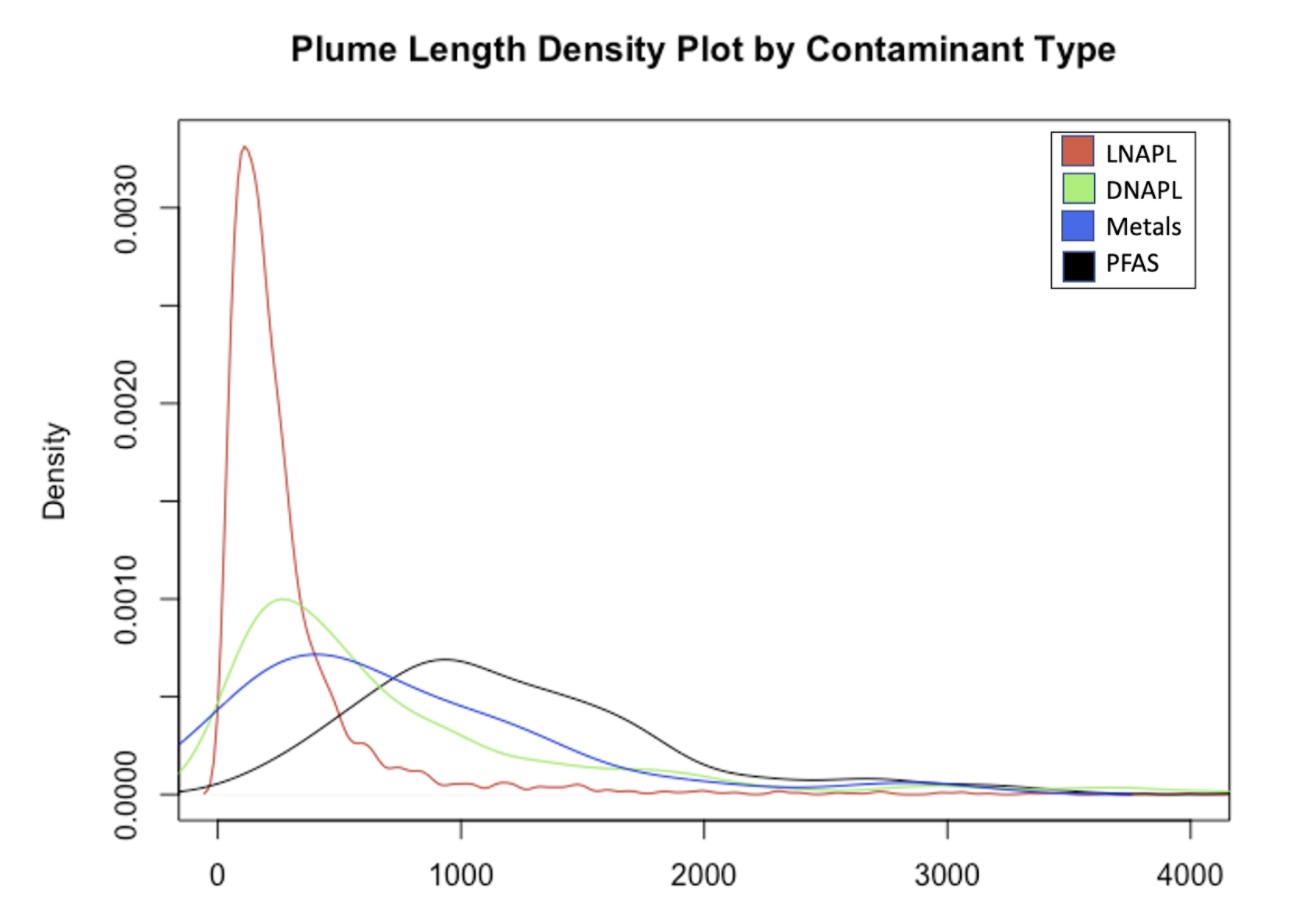
Figure: Plume Length Density Plot by Contaminant Type
| Contaminant Type | Most Prevalent Length Value (ft) |
|---|---|
| LNAPL | 110.5 |
| DNAPL | 265.3 |
| PFAS | 945.1 |
| Metals | 397.8 |
Table 4
As seen in the figure above and Table 4, the peak of PFAS plume length is more than 3.5 times that of DNAPL plume lengths for each data subset’s respective kernel density plots.
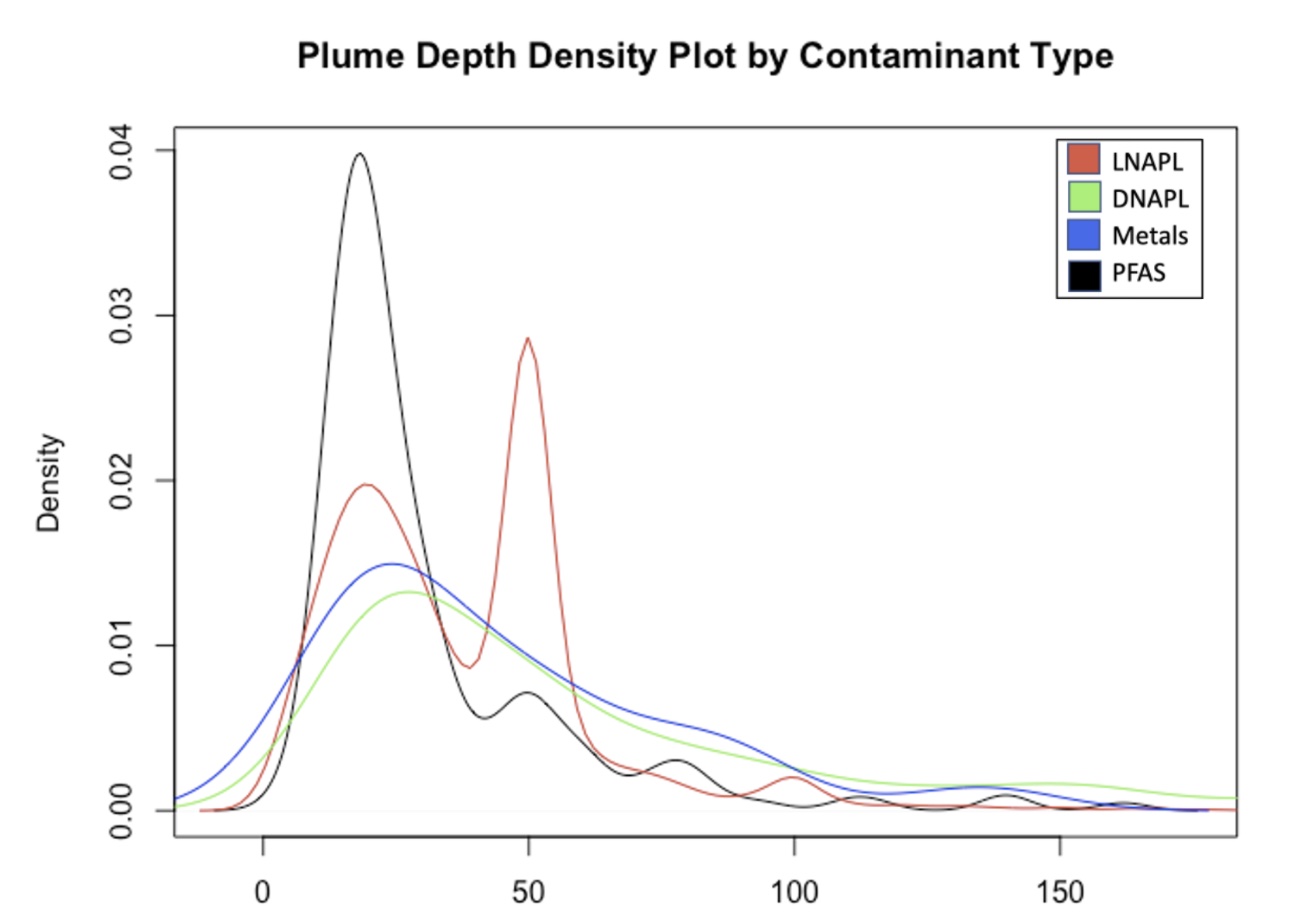
Figure: Plume Depth Density Plot by Contaminant Type
| Contaminant Type | Most Prevalent Depth Value (ft) |
|---|---|
| LNAPL- bimodal | 18.9 & 49.8 |
| DNAPL | 27.3 |
| PFAS | 18.3 |
| Metals | 24.1 |
Table 5
As seen in the figure above and Table 5, the peak of DNAPL plume depth is more than 1.5 times that of PFAS plume depths for each data subset’s respective kernel density plots. It’s also interesting to note that the depth kernel density distribution of LNAPL plumes appears to be bimodal. The main peak occurs at 49.80668 ft and the lower peak at 18.908 ft. It’s worth noting that the data are stacked around common round numbers that are often used for sampling depths (for example 20, 50, 100 feet below ground surface).
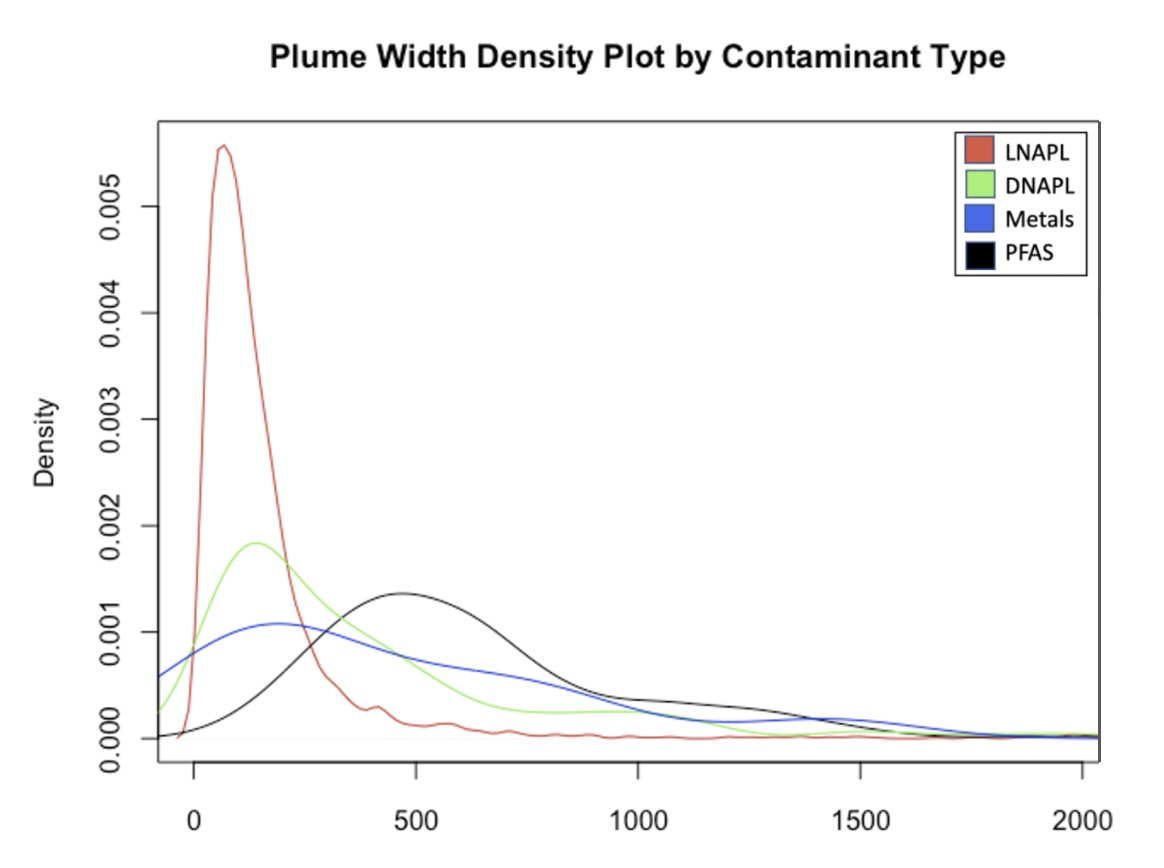
Figure: Plume Width Density Plot by Contaminant Type
| Contaminant Type | Most Prevalent Width Value (ft) |
|---|---|
| LNAPL | 68.8 |
| DNAPL | 145.3 |
| PFAS | 465.6 |
| Metals | 194.5 |
Table 6
As seen in the figure above and Table 6, the peak of PFAS plume widths is more than 3 times that of DNAPL plume widths for each data subset’s respective kernel density plots.
PFAS by Site Type:
Sites were broken down by the type of release event/site description.
| Site Description | Mean Plume Length (ft) | Mean Plume Width (ft) |
|---|---|---|
| WasteWater Treatment Plant | 882 | 338 |
| Plane Crash Site | 1972 | 882 |
| Industrial/Commercial | 1065 | 292 |
| Firefighting Foam Application- Military Installment | 1418 | 743 |
| Firefighting Foam Application- Military and Airport | 866 | 512 |
| Firefighting Foam Application- Airport | 1451 | 974 |
| Fire Fighting Training Location | 4218 | 2183 |
| Chemical Storage | 735 | 348 |
| Drainage Pond | 878 | 368 |
| Unknown | 90 | 56 |
Table 7
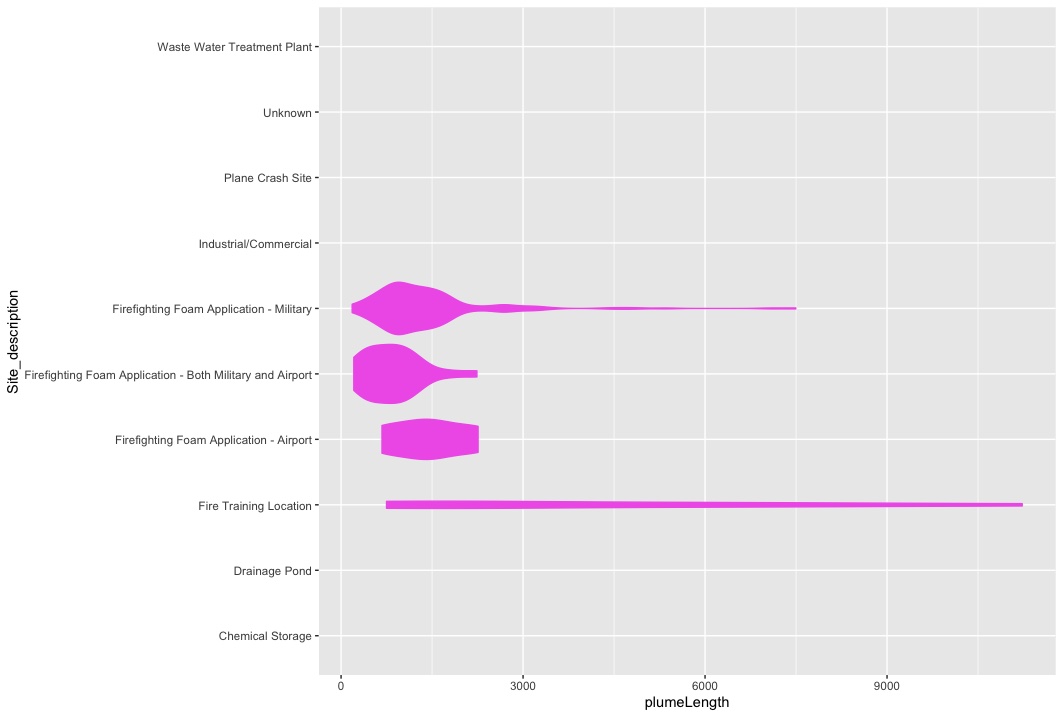
Figure: Plume Length Violin Plots by Site Type
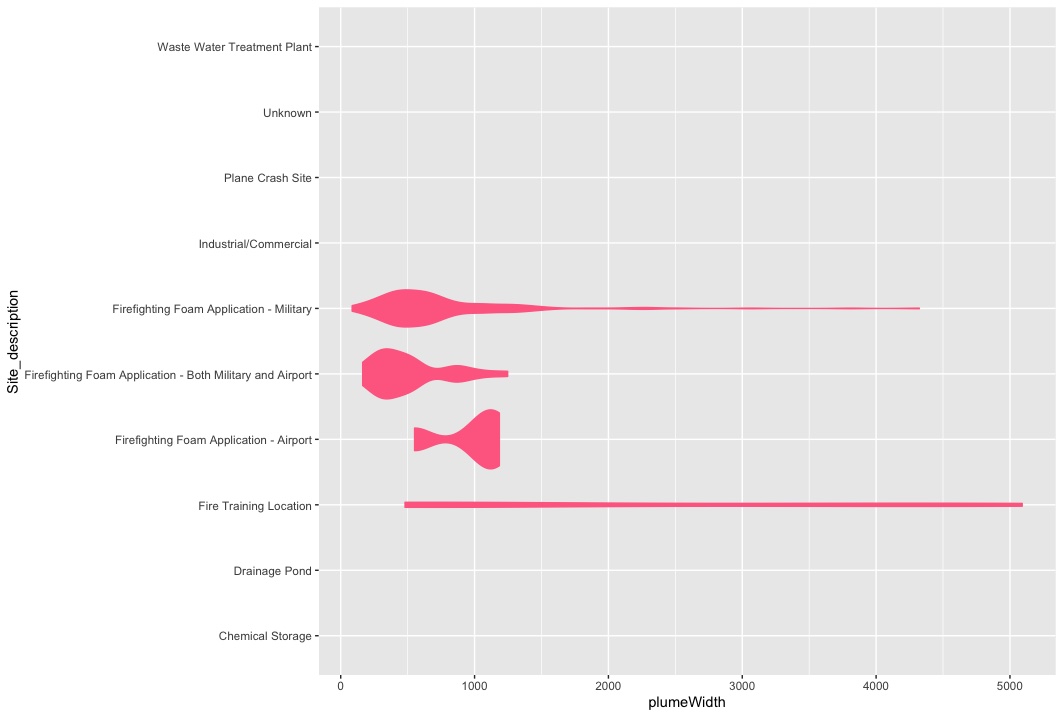
Figure: Plume Depth Violin Plots by Site Type
What factors contribute to PFAS distribution in the environment?
- Plume length: We performed a multivariate linear regression comparing the length of PFAS plumes to observed site variables depth to water, hydraulic conductivity of the most conductive layer present at site, and total maximum concentration of all PFAS chemicals present at site. For the length of PFAS plumes, changes in hydraulic conductivity of the most conductive layer present at site and observed depth to water at site are associated with changes in plume length. Total maximum concentration of all PFAS chemicals present at site are not significantly associated with changes in plume length.
- The bottom line? PFAS plume lengths are influenced by the site’s hydraulic conductivity and depth to water.
- Plume depth: We performed the same multivariate analysis comparing the depth of PFAS plumes to the same predictive variables mentioned above. For the depth of PFAS plumes, changes in observed depth to water at site is associated with changes in plume depth. Changes in hydraulic conductivity of the most conductive layer present at site and total maximum concentration of all PFAS chemicals present at site are not significantly associated with changes in plume depth.
- The bottom line? PFAs plume depths are influenced by the depth to water at the site (which is to be expected).
- Plume width: Finally, we performed the same multivariate analysis comparing the width of PFAS plumes to the same predictive variables mentioned above. For the width of PFAS plume, changes in observed depth to water at site and hydraulic conductivity of the most conductive layer present at site are associated with changes in plume width. The total maximum concentration of all PFAS chemicals present at site are not significantly associated with changes in plume width.
- The bottom line? PFAS plume widths are influenced by the site’s hydraulic conductivity and depth to water.
| Plume Dimension | R-squared | P-value of the F-statistic |
|---|---|---|
| Plume length | 0.08114 | 0.0002629 |
| Plume depth | 0.4217 | < 2.2e-16 |
| Plume width | 0.09344 | 6.155e-05 |
Table 8
Final Thoughts
The most interesting thing we learned from this analysis is that (at least for our data set), maximum concentration of PFAS at a site’s source area is not a strong predictor of plume size. In previous data analyses we have performed of our data set for other contaminant types (LNAPL, DNAPL, etc.), the maximum contaminant concentration at the source area was a strong predictor of plume size.
We’ve quantitatively confirmed from this analysis that standard practices from LNAPL and DNAPL won’t be sufficient to address PFAS impacted sites.
How does this data analysis compare to your experience with PFAS contamination? Are there other questions you wished we had answered? Do you have a site with PFAS contamination where machine learning could help understand the scope of contamination? Let us know! Email us at contact@azimuth1.com