As you may have read in our preceding post, the Search and Rescue (SAR) map we are building seeks to combine the vital features of USGS topographic maps with the ease of use, readability, and higher update frequency of a vector tile based map, in addition to providing supplemental data that may prove useful in SAR related work. This follow-up post is meant to further elaborate on the process behind the SAR map’s creation and current status.
A brief introduction
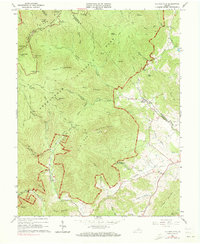 To start things off, I love the old USGS topographic maps. I love their style. I have a 1984 Old Rag quadrangle hanging above my desk. Those older USGS topos featured more detailed surface features (e.g. trails and utilities) but are, unfortunately, limited by their age and format. Newer USGS topos are generally in GeoPDF, a format which allows for multiple layers that can be toggled depending on the view you want, all enveloped together in a PDF. This comes with its own advantages, however they do not include some of the more specific features one would want for SAR work, as reviewed in Jason’s post. In addition, GeoPDF not a particularly lightweight platform. With our SAR topo we hope to take everything that’s great about both the older and newer USGS topographic maps, add in any other data that will prove useful in a search and rescue situation, and provide a fully interactive map that can still be used in offline field situations.
Picking a platform
When we were first exploring possible platforms for this project, we’d started with Mapbox and their new map design tool Mapbox Studio. The initial prototype for the SAR map was inspired by the Mapbox Outdoors style and source in Studio. However, we ran into two primary issues.
- The more data we wanted to incorporate into the map, the less Mapbox Studio seemed suited to our needs. With the wide variety of substantial datasets we’re working with, this project just doesn’t lend itself to efficient use of the Studio model, which is highly suited to rapid, lightweight web map development and styling.
- Mapbox does not currently support combining both remote and local data sources for vector tile source creation and styling via Studio, and for the purposes of this prototype we wanted to create something completely independent of sources that require internet access, to support use in the field by searchers.
That being said, Mapbox Studio is a very powerful, and actively evolving design tool. The work we did initially in Studio really provided a foundation for how we decided to move forward with the project. Using both the OpenStreetMap data and the supplemental SAR data we’d compiled for styling in Studio, we created an .mbtiles archive. MBTiles is “an efficient format for storing [large vector and raster tilesets] in a single SQLite database.” Once these sources are combined and exported, we can locally host them with relative ease. For this prototype, we’re using a simple Node server for hosting the tiles in concert with Mapbox GL, Mapbox’s OpenGL based vector tile renderer, for the client side rendering. This is further detailed below in Work Flow, followed by an overview of all the different datasets we used in Data Sources and Layers.
Work Flow
- Data wrangling. Compiling all of the necessary data from a wide variety of sources.
- Generate PostGIS database for OpenStreetMap data using osm2pgsql.
- Currently prototyped with an extract of Virginia, if we continue with this method we will have to expand beyond a locally hosted database to include the rest of the necessary OSM data OR switch to a method which caches tiles from a web based map for offline use, as opposed to 100% local hosting.
- Combine queried OSM data with the additional SAR relevant datasets in Mapbox Studio.
- See Data Sources and Layers.
- Export vector tileset from Studio for self-hosting.
- Locally host the .mbtiles archive via Node.
- The process for setting up a simple Node server for viewing the vector tile set is based on this GIS StackExchange thread. It incorporates the node modules Express, TileLive, and mbtiles
- Render and style map with Mapbox GL.
- Prototyped in CartoCSS within MapBox Studio, rewritten in the Mapbox GL JSON structure.
- Note: Having gone through the process of rewriting all of my Mabox Studio styling in JSON for Mapbox GL, I’d be very interested in seeing a tool for the conversion between the Studio and GL styling languages. I know it’s not a perfect “one-to-one” conversion in that they are pretty different systems, but it still seems like a gap in the Mapbox workflow. Maybe this will be filled by the new Mapbox GL Design tool, which is currently in beta.
- This vector tile rendering utility can be contained within a single local Javascript utility, e.g. NW.js, for simple offline use.
- The Virginia prototype takes up just under 3 GB, easy to store a flash drive.
Data Sources and Layers
- United States elevation contours, Source: USGS.
- USGS Hydrogeography dataset, Source: USGS NHD.
- National Land Cover Database 2011, Source: MRLC.
- Exploring more recent vector datasets for this.
- Roads, trails, transportation infrastructure, and building footprints, Source: OpenStreetMap.
- More detailed and regularly updated than comparable USGS data.
- United States interstate and intrastate natural gas pipelines, Source: EIA.
- United States local natural gas infrastructure, Source: OpenStreetMap.
- Note: Collected as a supplement to the smaller scale, national level EIA dataset, queried as
man_made=pipelineandlocation!=underground,underwater.
- Note: Collected as a supplement to the smaller scale, national level EIA dataset, queried as
- United States power lines, Source: OpenStreetMap.
- Note: No declassified national power infrastructure dataset exists, queried from OSM as
power=lineandpower=minor_line. - Visual buffer around utilities to show potential cleared canopy around power lines, gas lines, etc.
- Note: No declassified national power infrastructure dataset exists, queried from OSM as
- Shelter locations, Source: OpenStreetMap.
- Query includes all features
amenity=shelterandshelter_type!=public_transport(e.g. bus shelters, covered train platforms). Unfortunately there are a large number of shelter features that do not include theshelter_typetag. - You can see a full listing of all the shelter sub-types in OSM here. In addition to features included under
amenity=shelter, there are a number of other tags that could contain shelters relevant to SAR: e.g.tourism=wilderness_hut,tourism=alpine_hut, andbuilding=hut. For the most part features with these more specific IDs are also tagged withamenity=shelter, and those outliers were mostly private residences or paid lodging (at least within the US). Another potentially relevant shelter tag wasshelter_type=rock_shelter, unfortunately though there are no features currently tagged as such in the US (I guess I’ll have to start mapping those on my hikes).
- Query includes all features
- Emergency Medical Services and Fire Stations, Source: OpenStreetMap.
- Query includes all features
amenity=clinic,amenity=doctors,amenity=hospital,amenity=veterinary,amenity=rescue_station, andamenity=fire_station.
- Query includes all features
- Churches, frequently used for Incident Command Post (ICP), Source: OpenStreetMap.
- Query includes all features
amenity=place_of_worship.
- Query includes all features
- Mountains and other topographic highs, Source: OpenStreetMap.
- Query includes all features
natural=peak. - Elevation from OSM is included in label.
- Query includes all features
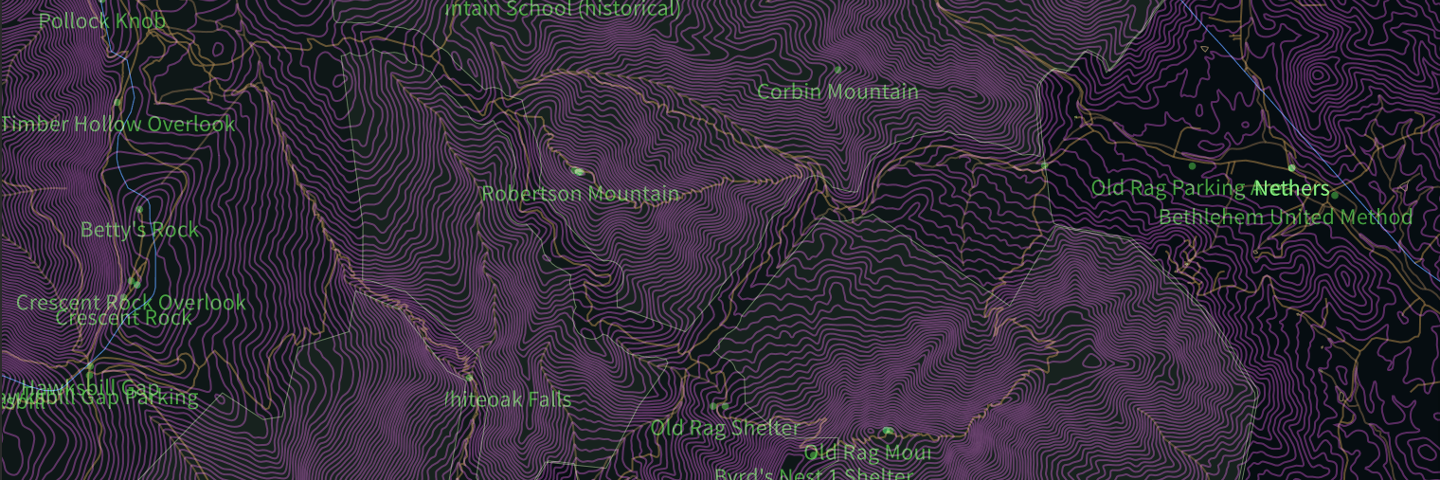
You can view the map below and here.
As it stands
There are still quite a few things to work on with this prototype, beyond improving general performance: there’s a whole lot to be done with the dynamic labeling, we need to add airport information (e.g. runways, boundaries, etc), distinguish dirt roads from paved roads with more distinctive styling, add styling for mines and caves, add pattern overlay for wetlands, update the land cover data, and refine a few of the OSM queries, just to name a few. Blue contour lines over snow or ice cover have been suggested, as well as differentiating between tree canopy type (e.g. deciduous vs coniferous). Please let us know of any additional features you feel could be potentially helpful to SAR efforts that you’d like to see included in the map!
Note: For the purpose of this web demo, a Mapbox API key is used for access to glyphs and sprites. At the moment I’m exploring a few of the tools in Mapbox’s repo for storing this information locally for offline use, e.g. fontnik, node-fontnik, and spritenik. However, I recently learned that Mapbox GL is working towards using HarfBuzz for this, which would render local storage for font rendering unnecessary.